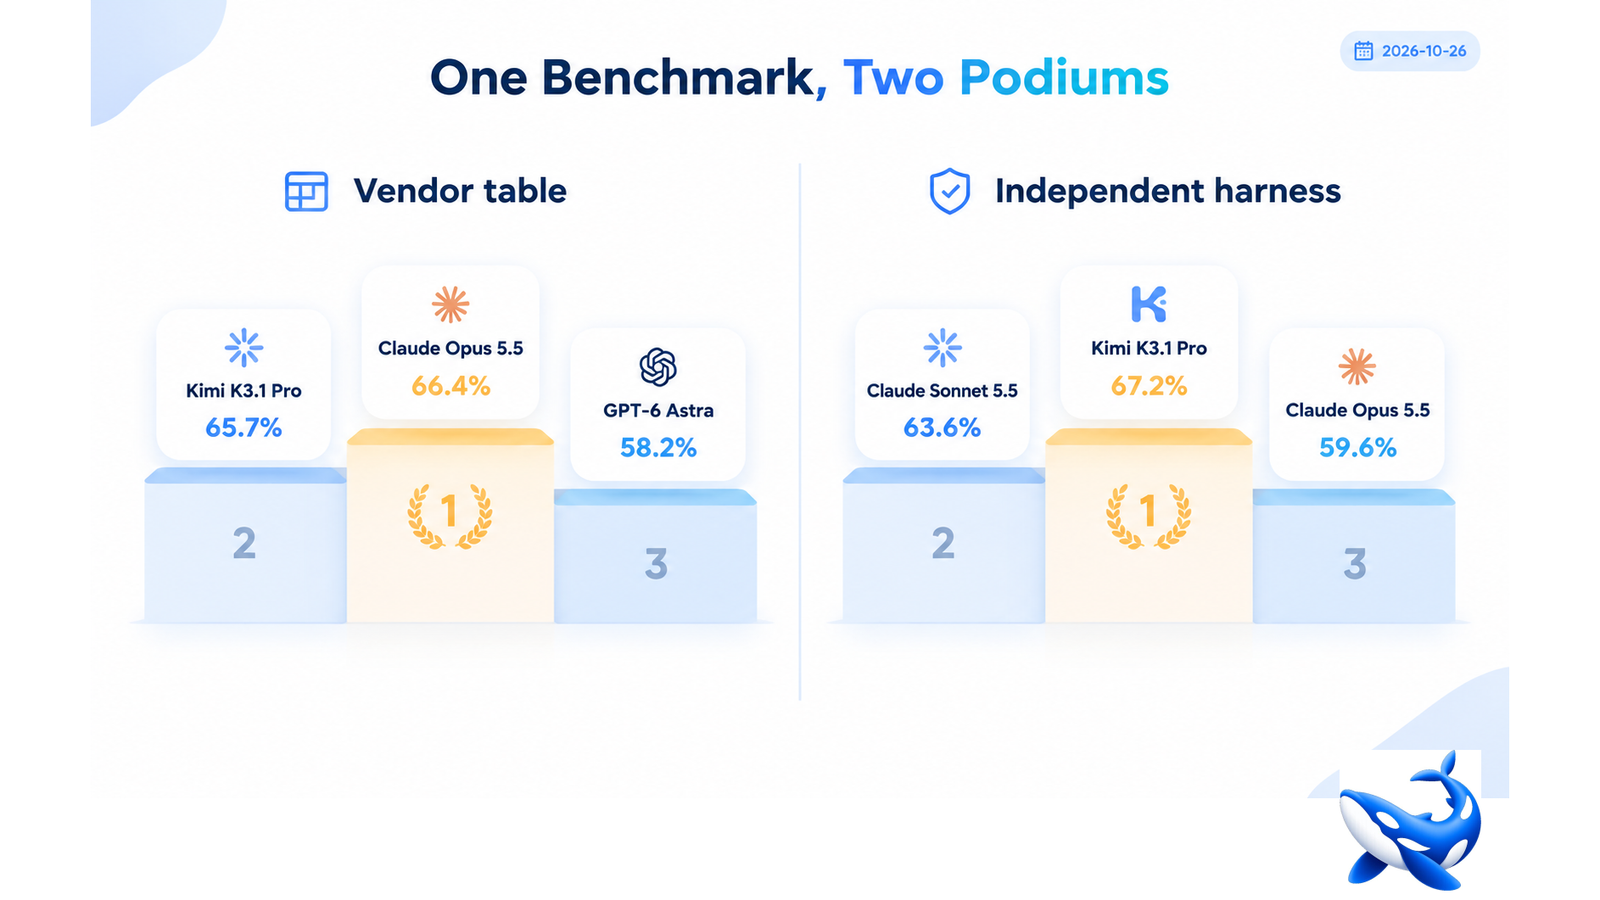
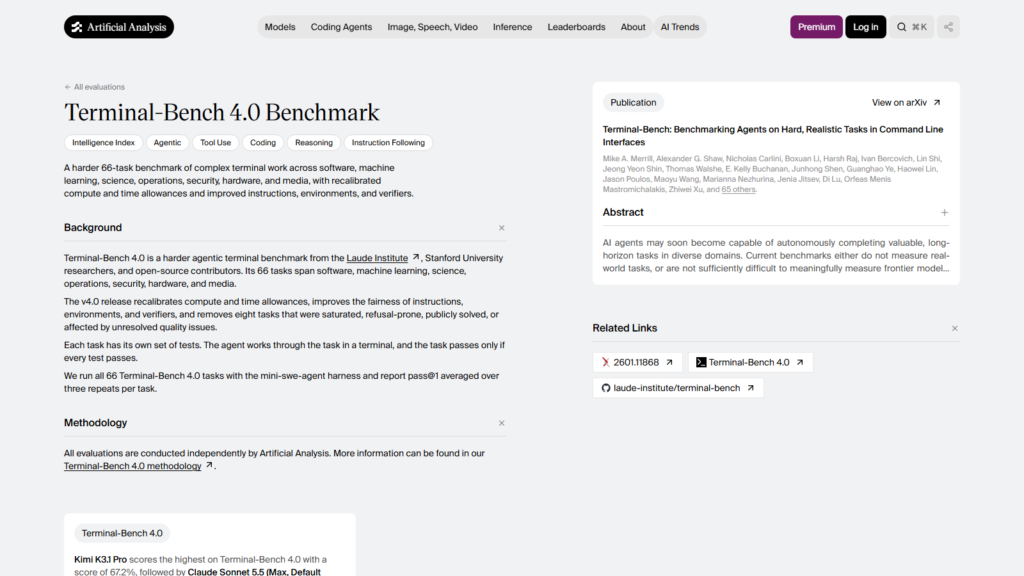
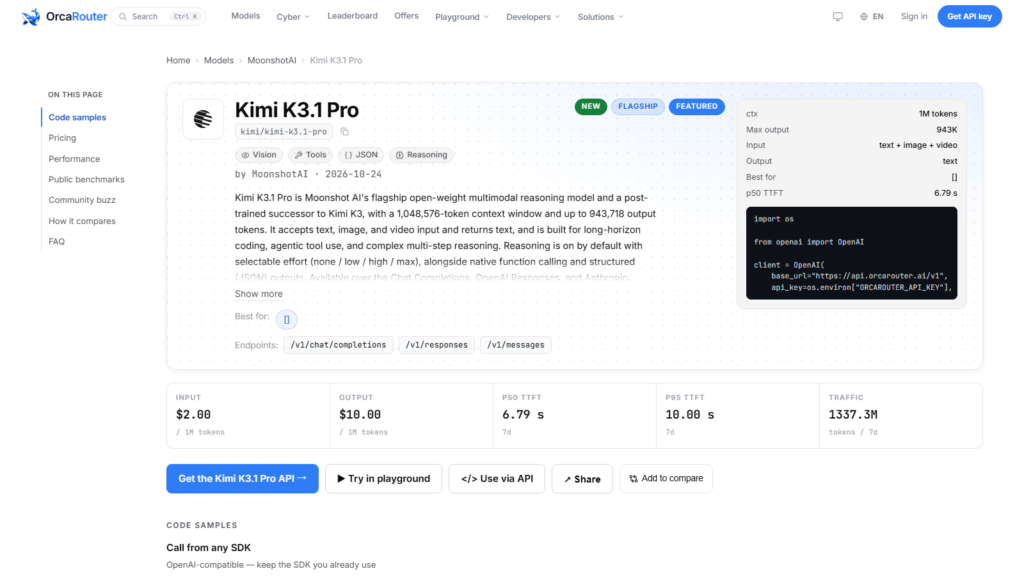
Terminal-Bench 4.0 is the benchmark that decides arguments about agentic coding this month, and Kimi K3.1 Pro has the strangest result on it of any model in the field: first place on one chart and second on another, with the same benchmark name on both. On Artificial Analysis’s harness it scores 67.17%, which the evaluator describes as the highest score of any model [INDEPENDENT]. On Moonshot’s own table it scores 65.7%, which puts it behind Claude Opus 5.5 at 66.4% [VENDOR]. OrcaRouter‘s Kimi K3.1 Pro card carries the independent figure at 67.17% next to a $2.00/$10.00 rate card passed through at list, and this article is about why the two tables disagree and which number you should carry into a procurement document.
The short answer: they disagree because they are measuring different things and calling both of them Terminal-Bench 4.0. The long answer is more useful, because the same trap will catch you on the next model release.
The two tables
| Rank | Moonshot’s table [VENDOR] | Artificial Analysis [INDEPENDENT] |
| 1 | Claude Opus 5.5 — 66.4% | Kimi K3.1 Pro — 67.17% |
| 2 | Kimi K3.1 Pro — 65.7% | Claude Sonnet 5.5 — 63.64% |
| 3 | GPT-6 Astra — 58.2% | Claude Opus 5.5 — 59.60% |
| 4 | — | GPT-6 Astra — 59.09% |
| 5 | — | Gemini 4 Argon — 57.07% |
| 6 | — | GPT-6.1 Sol — 56.06% |
Three facts sit in that table and are worth separating.
The first is that both tables agree Kimi K3.1 Pro is in the top two. That is a stronger statement than either ranking alone, because two organisations using different scaffolds arrived at the same neighbourhood from different directions.
The second is that the vendor’s own table does not put its model first. That is unusual enough to be newsworthy on its own: the company published a headline benchmark on launch day and ranked its new model second, behind a competitor.
The third is that the independent harness scores *both* Claude models differently from the vendor table, and in opposite directions — Sonnet 5.5 comes out third at 63.64% on AA, a model Moonshot’s table does not compare against at all, while Opus 5.5 falls from 66.4% to 59.60%. When a competitor’s number moves six points between harnesses, the ordering between labs is not a fact about the labs.
Why the Opus number moved six points
Moonshot’s footnote says it plainly, and it is the most useful sentence in the launch material: Opus 5.5’s 66.4% was produced at xhigh effort, one level above its default [VENDOR]. Kimi’s own run is at the model’s default, which for K3.1 Pro is `max` — the top setting. So the vendor comparison is a top-effort Kimi against a top-effort Opus, which is the fairest version of the comparison and also the version least likely to represent what either model does when you call it without touching a parameter.
AA’s harness runs models at their own configurations and reports the configuration. Opus 5.5’s 59.60% is its measured row, not a deliberately weakened one. The six-point difference between 66.4 and 59.60 is the price of an effort setting, and it is larger than the difference between first and second place on either table.
That is the single most important thing to understand about this benchmark: effort settings move scores further than models do. On Anthropic’s own published table, one coding benchmark moves 5.3 points between medium and xhigh effort on the same model, while another moves 0.2. A vendor run that does not state its effort level is unauditable; a comparison table that mixes effort levels is comparing settings, not models.
See also: Aerial Drone Inspections: Smarter Infrastructure Monitoring With Thermal Technology
What Terminal-Bench 4.0 actually asks
It is an agentic benchmark. The model is given a terminal, a task and a time budget, and it has to operate the machine — write files, run commands, read output, recover from errors — until the task passes an automatic check. It measures whether a model can hold a plan together across dozens of tool calls without losing the thread, which is the actual skill in coding agents and is only loosely correlated with single-shot code generation.
That is why the benchmark is so sensitive to scaffolding. The harness decides how tool output is formatted, how errors are surfaced, how much context is carried between steps, and whether the model gets retries. Change any of those and the score moves by points. Terminal-Bench results are therefore best read as a comparison *within one harness*. Comparing a 65.7 from one lab’s scaffold to a 58.2 from the same lab’s scaffold is legitimate. Comparing a 65.7 to a number another lab produced under its own scaffold is a comparison of two research setups.
The AA number is valuable precisely because it puts every model through one setup. It is also the reason to expect it to disagree with a vendor table: one harness cannot simultaneously be the most flattering setup for every model.
What the score means for a coding workload
If you are choosing a model for an agent that runs shell commands, the ranking you should care about is the one from the harness closest to yours. AA’s 67.17% is measured with a general-purpose scaffold, and if your agent is a general-purpose scaffold, that is the better predictor. Moonshot’s 65.7% is measured with Moonshot’s own tooling, which is a fine predictor for Kimi Code and a weaker one for your home-grown runner.
What you can take as established across both harnesses:
It is a top-two model for terminal work. Two independent setups agree.
It is dramatically better than its predecessor here. Kimi K3 measures 12.63% on AA’s harness against 67.17% for K3.1 Pro [INDEPENDENT]. Whatever the mechanism, if you tried K3 for agentic terminal work and gave up, that judgement does not transfer.
It is not better than Opus 5.5 by a distance you can bank. The independent gap is 7.6 points in Kimi’s favour; the vendor gap is 0.7 points in Opus’s favour. The honest reading is that they are in the same band and the band is wide.
Cost per passing task is the number to compute, not score. At $2.00 input and $10.00 output, a Kimi run that passes in 40 tool calls can cost less than an Opus run at $4.00 and $20.00 that passes in 25. Nobody publishes cost-per-pass on this benchmark; you have to measure it on your own tasks, and it is the only figure that decides a production choice.
How to read the next launch table
Four checks that take a minute and save a quarter:
1. Is the effort setting stated for every row? If not, the table compares settings.
2. Was every row produced by the same harness? If not, the table compares scaffolds.
3. Is there a row the vendor’s model loses? A table with no losing row is not a measurement, it is a selection. Moonshot’s table gets credit here: it publishes the second place and the effort footnote that explains it.
4. What does the independent harness say? If there is no independent row, wait. For this model there is one, and it agrees on the band while disagreeing on the order.
Kimi K3.1 Pro’s Terminal-Bench result is the best single piece of evidence that this release is real: a post-training run that took a 12.6% agentic terminal score to something in the high sixties, on one harness, is a step change rather than a rounding error. It is also, depending on which table you read, either the best terminal agent on the market or the second-best behind a model that costs twice as much. Both readings are defensible today, which is the most accurate thing anyone can say about it.
Sourcing note: the 65.7% / 66.4% / 58.2% table and the xhigh-effort footnote are Moonshot’s launch material, unreproduced by us. The 67.17% and every other independent row are Artificial Analysis on index v4.3.2, read 26 October 2026, which also supplies the K3 predecessor figure of 12.63%. Our card mirrors the independent figure and states it as AA-sourced. The cost-per-passing-task point is ours and is not a published number.